Real-time data analytics can be a powerful differentiator for businesses. But how should you approach it to maximize output and keep costs in check? Get answers to these questions - and many more - in this definitive guide.
Real-time analytics is changing the way we work with data. The days of generating dashboards in the morning based on data processed overnight are over. Now, we look to build real-time dashboards and embed analytics into user-facing products and features. In this arena, real-time analytics can provide powerful differentiation for modern companies.
But, real-time data analytics can come at a cost if approached the wrong way, something today’s cost-conscious engineering teams are forced to grapple with. Everybody likes the idea of real-time data analytics, but many carry the belief that the costs will outweigh the benefits. How can you use real-time data analytics while staying within your people, hardware, and cloud budgets?
This is your definitive guide to real-time analytics.
Read on to find everything you need to know about real-time analytics and how to cost-effectively build real-time analytics use cases for your business.
Tinybird is the real-time analytics platform for data and engineering teams. Unify streaming and batch data sources, build real-time analytics with nothing but SQL, and empower your organization to build differentiating features with real-time data. To start your real-time analytics journey with Tinybird, request a demo here.
Real-time analytics means spanning the entire data analytics journey, from capture to consumption, in seconds or less. Its function is to ingest streaming data, transform and enrich it, and expose it to user-facing applications or real-time data visualizations. It's a game-changer for modern data applications.
Unlike traditional data analytics, which utilizes batch data ingestion and processing techniques to serve business intelligence (BI) use cases, real-time analytics uses real-time data ingestion and processing to serve operational intelligence and user-facing analytics.
Real-time analytics can be further understood by its five core facets, namely:
You may be wondering, "How is real-time analytics different from traditional data analytics?" Real-time analytics differs from other approaches to data analytics, including business intelligence and streaming analytics.
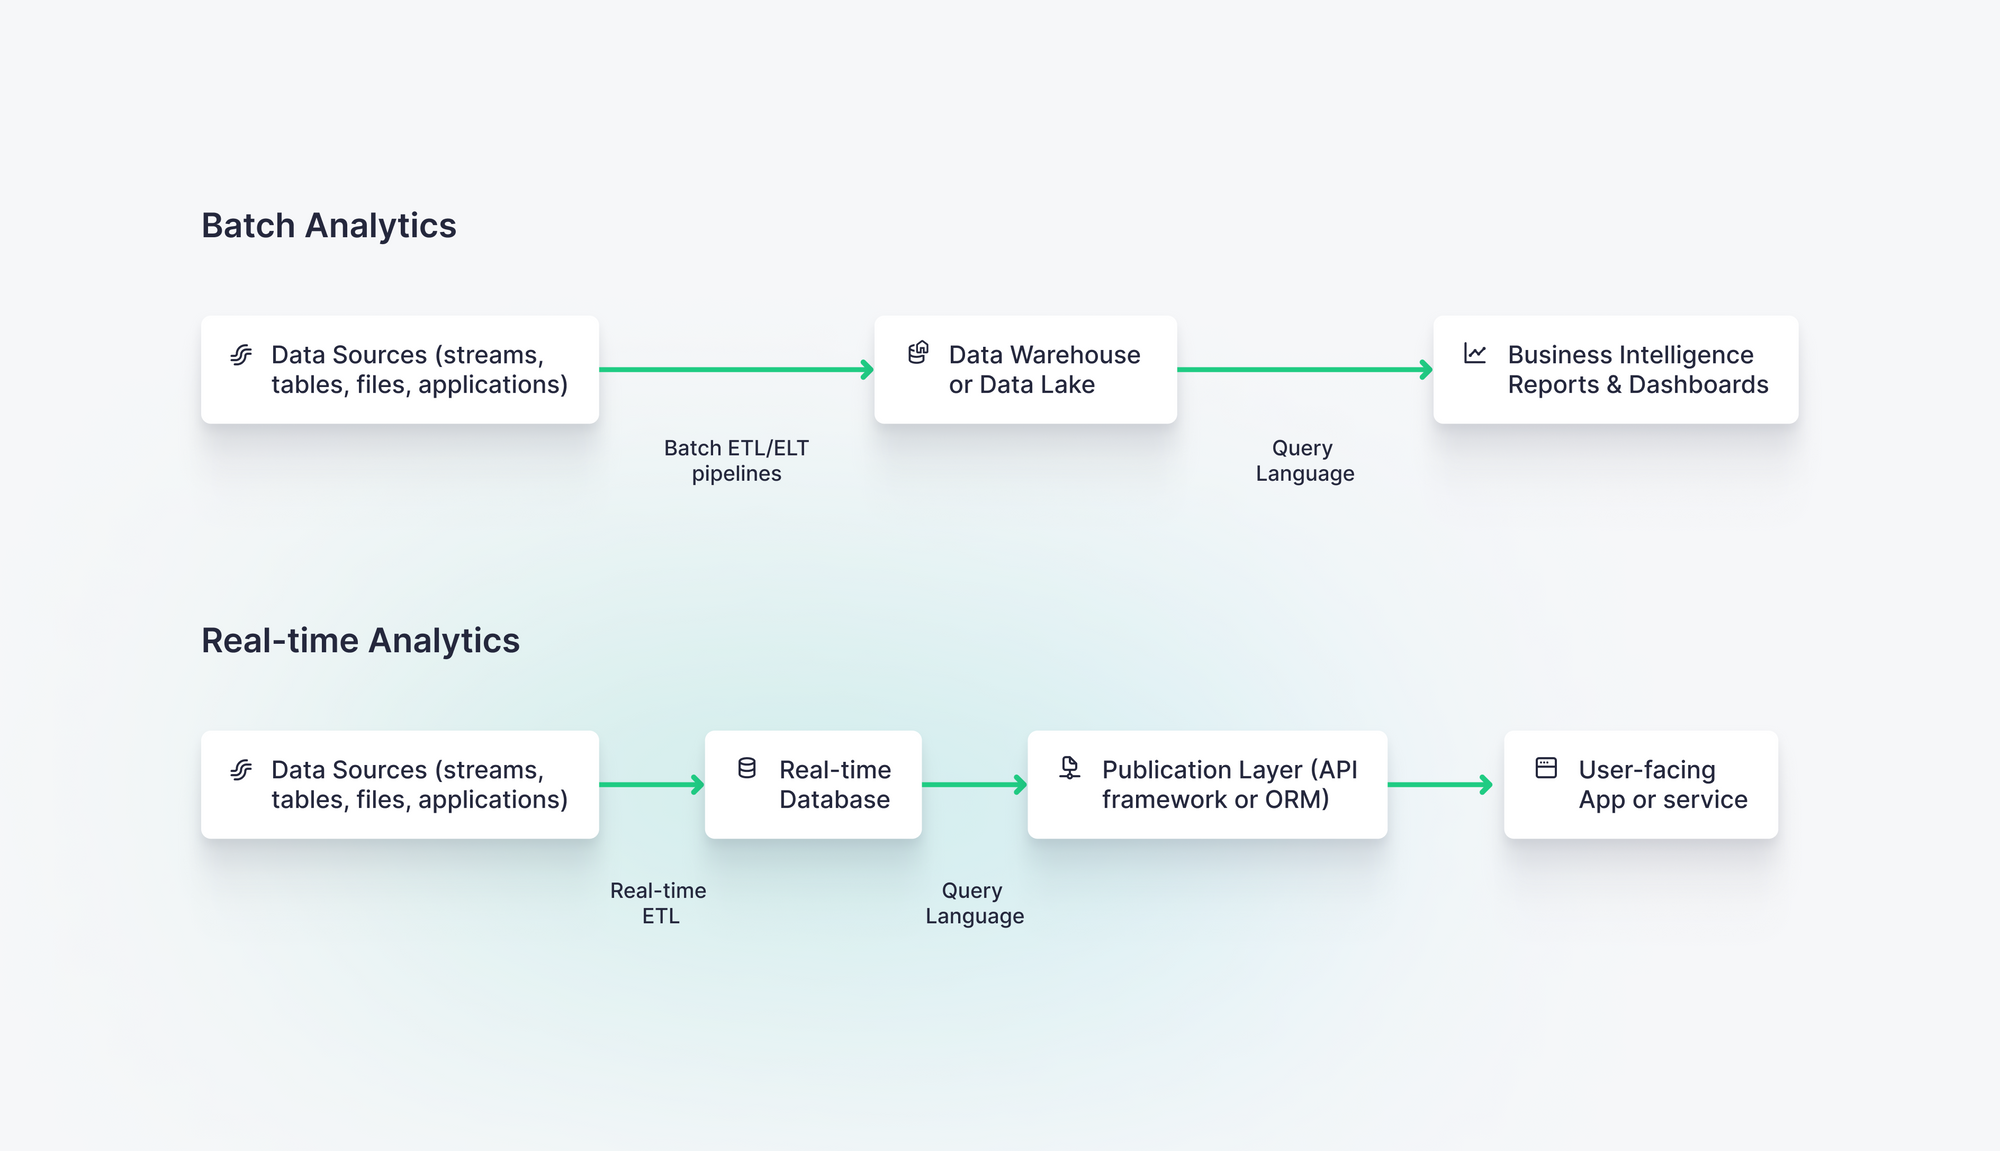
Batch analytics is a traditional form of data analytics often used for business intelligence (BI). It typically involves batch data processing techniques like extract, transform, load (ETL) or extract, load, transform (ELT) to capture data from source data systems, place that data in a cloud data warehouse, and query that data using SQL and data visualization tools designed for BI.
Batch data pipelines have proven tremendously useful for both business intelligence and data science disciplines. They can be used to generate traditional data analytics views and also train machine learning models that need to crunch and re-crunch large amounts of data over time.
Batch data processing leverages technical approaches - most notably data warehousing - based on its functional requirement to inform long-term business decision-making, most often at the executive and management levels.
 a query language, and a low-latency publication layer to power use facing apps or services." />
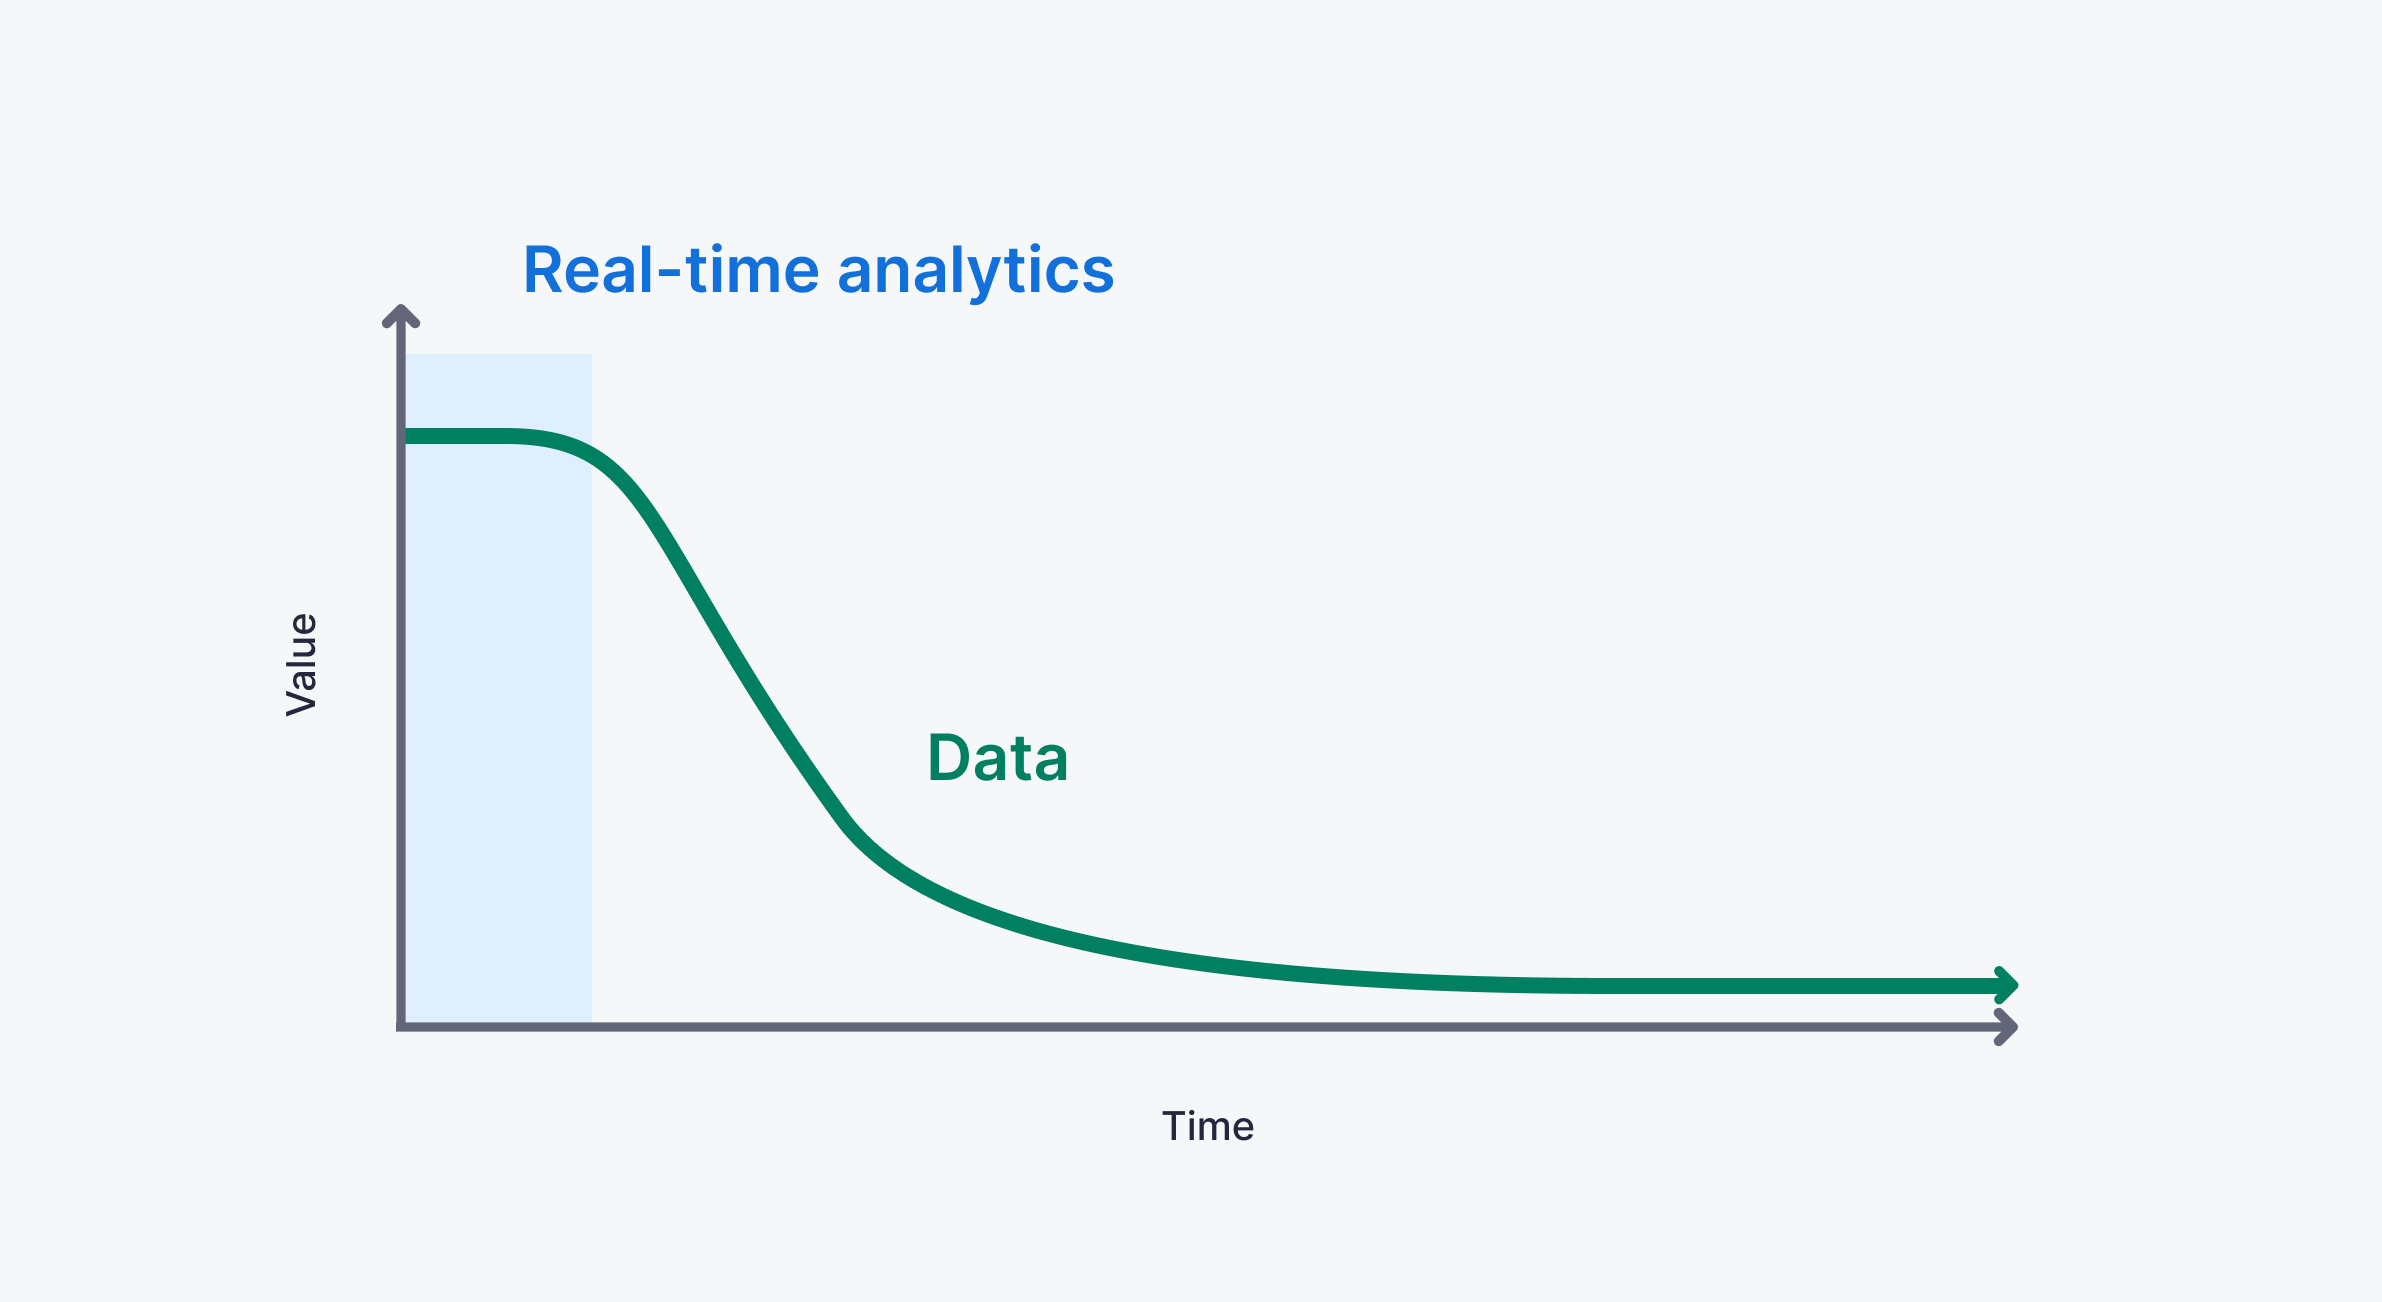
Real-time data analytics, on the other hand, helps with the tangible, day-to-day, hour-to-hour, and minute-to-minute decisions that materially impact how a business operates. Where batch focuses on measuring the past to predict or inform the future, real-time data analytics focuses on the present. It answers questions like “Do we need to order or redistribute stock today?” or “Which offer should we show this customer right now?”
Unlike batch analytics, real-time analytics depends on real-time data ingestion, capturing data into analytics systems using streaming platforms and event-driven architectures. It leverages real-time data processing, incrementally updating analytics immediately as new data is generated rather than waiting on scheduled ETL processes.
Batch analytics is most commonly used for business intelligence, whereas real-time analytics is most commonly used for customer-facing data
Functionally, real-time data analytics is increasingly being utilized to automate decision-making or processes within applications and services, as opposed to just populating data visualizations.
Because of this, real-time analytics utilizes a fundamentally different architectural approach and different tooling compared to batch analytics.
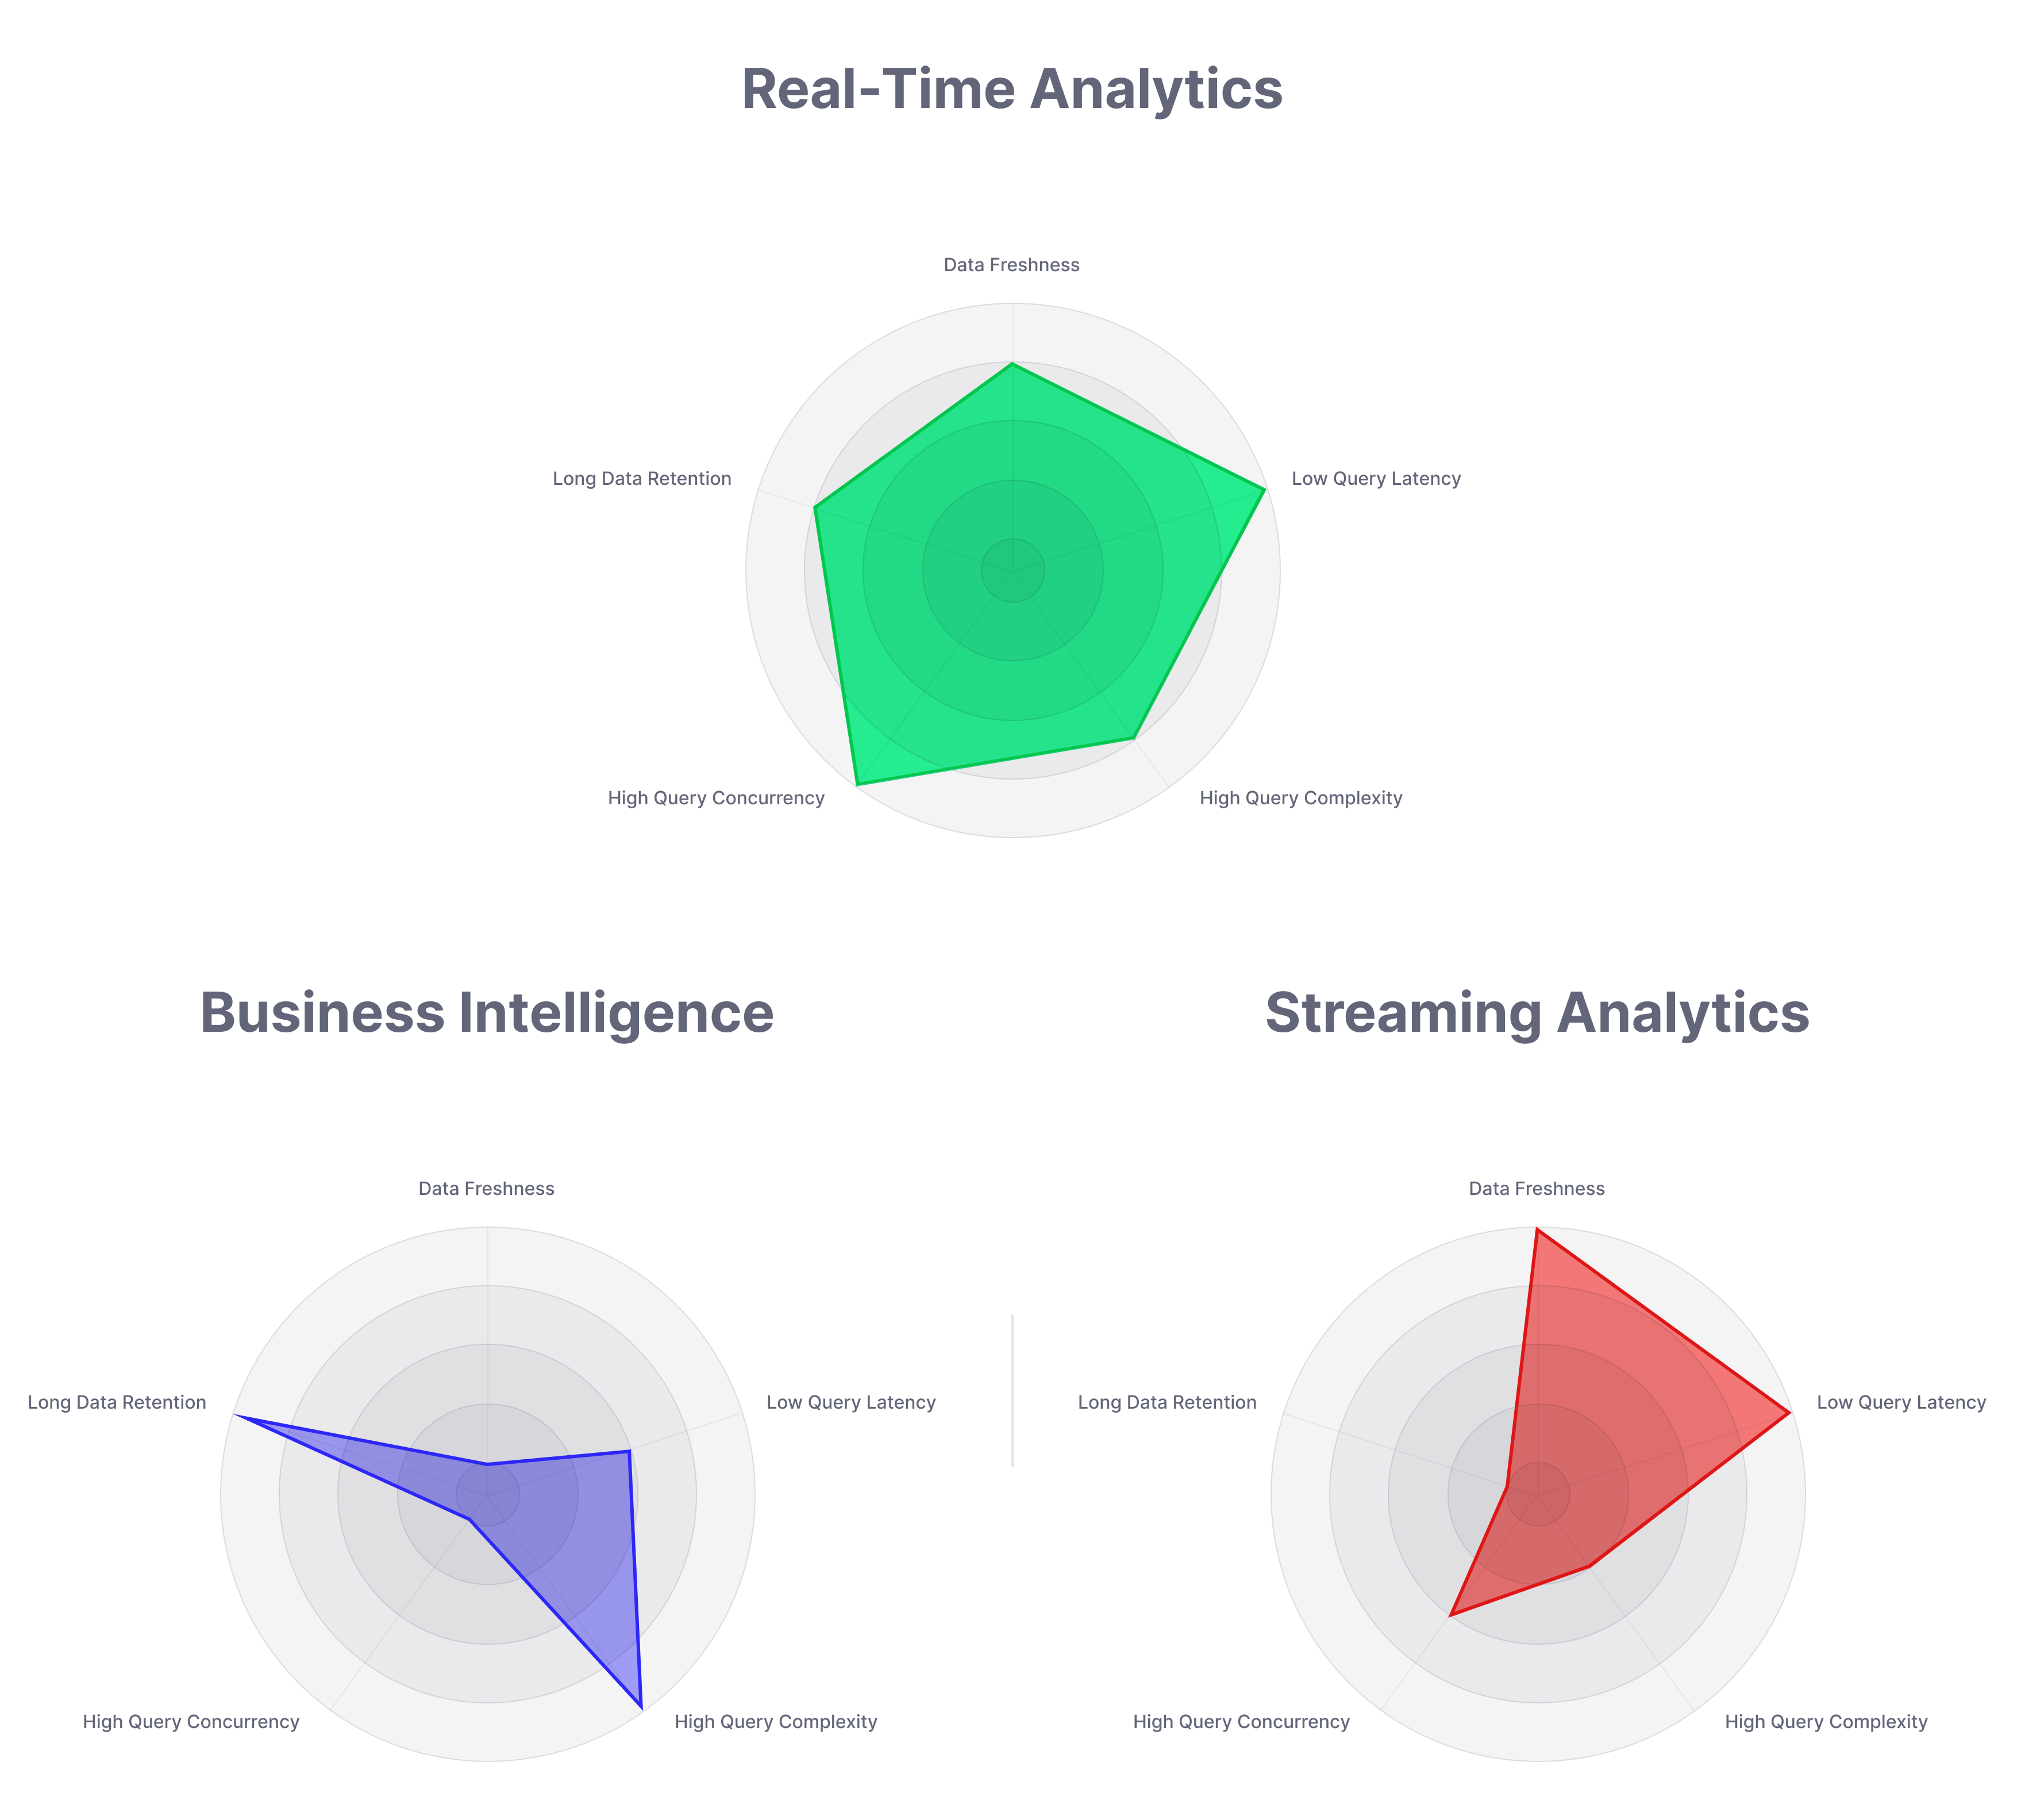
Sometimes real-time data analytics is confused with streaming analytics. There are several streaming analytics products available today. They work great for some streaming use cases, but they all fall short when handling the high-concurrency, low-latency, and long data retention demands of real-time applications.
Streaming analytics systems don't leverage a full OLAP database that enables queries over arbitrary time spans (vs. window functions), advanced joins for complex use cases, managed materialized views for rollups, and many other real-time analytics requirements.
Streaming analytics answers questions about a particular thing at a particular moment. Questions like “Is this thing A or B?” or “Does this piece of data have A in it?” as data streams through. Streaming data analytics allows you to ask simple questions about a few things very close together in time. It can offer very low latency, but it comes with a catch: it has limited “memory.”
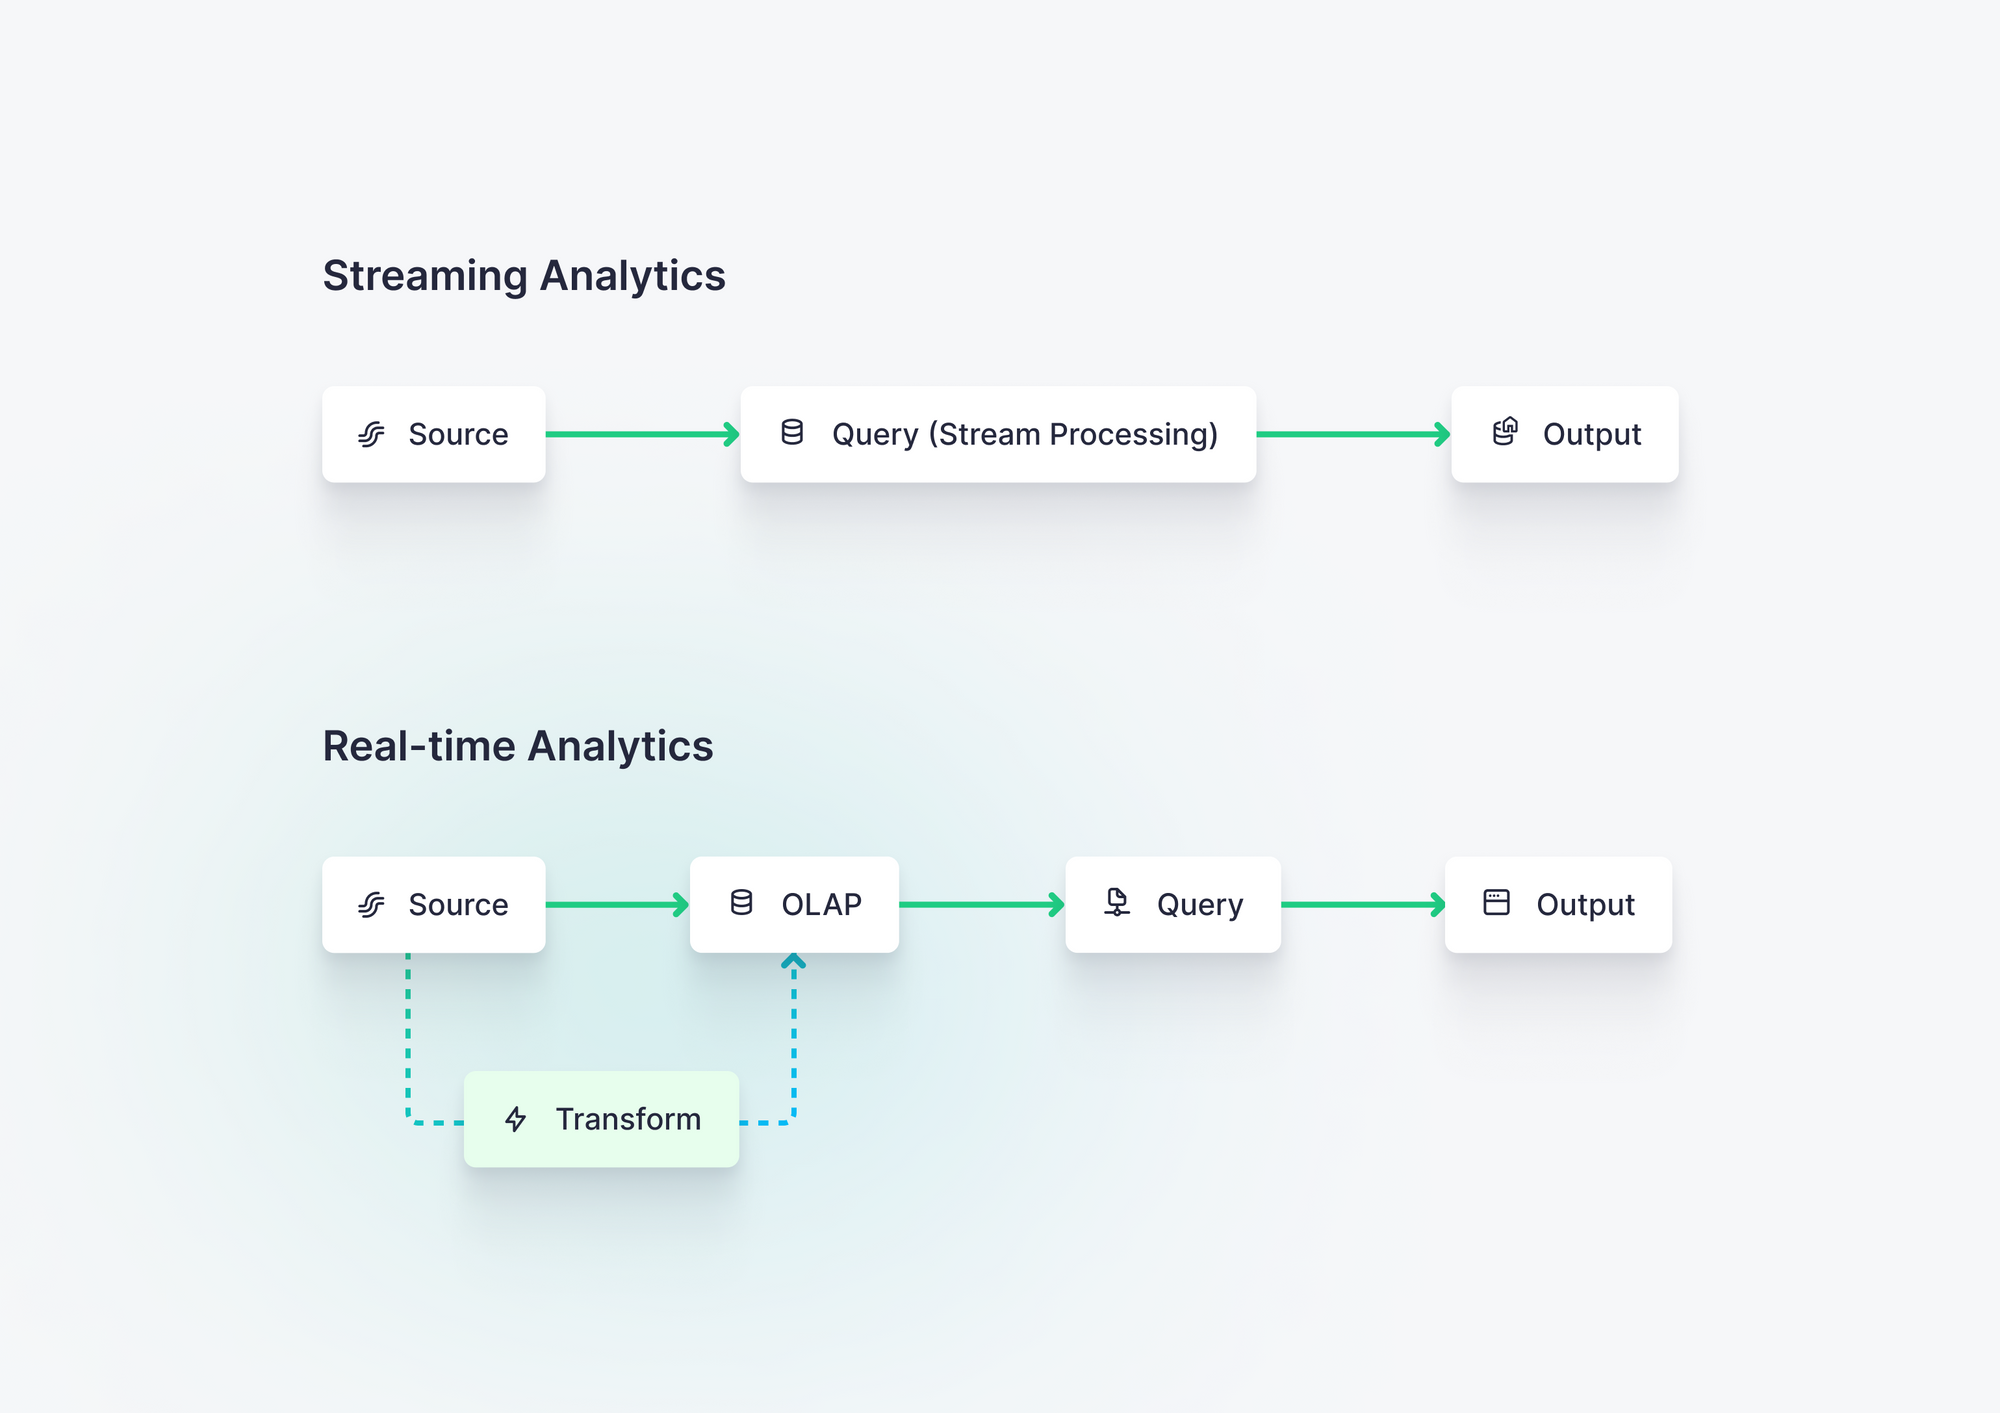
Real-time data analytics, in contrast, has a long memory. It very quickly ingests data and retains historical data to answer questions about current data in the context of historical events. Unlike streaming analytics, which uses stream processing engines for transformations, real-time analytics leverages a full online analytical processing (OLAP) engine that can handle complex analytics over unbounded time windows.
In addition, real-time analytics often supports "pull-based" user-facing APIs with variable demand, whereas streaming analytics is often used to sink analytical transformations into a data warehouse or in-memory cache.
When you think about data analytics, you probably picture some dashboard with a combination of bar charts, line charts, and pie charts.
While real-time analytics can certainly be applied to building real-time data visualizations, the possibilities that real-time analytics enables extend beyond just dashboarding.
Below are real customer examples of real-time analytics in action:
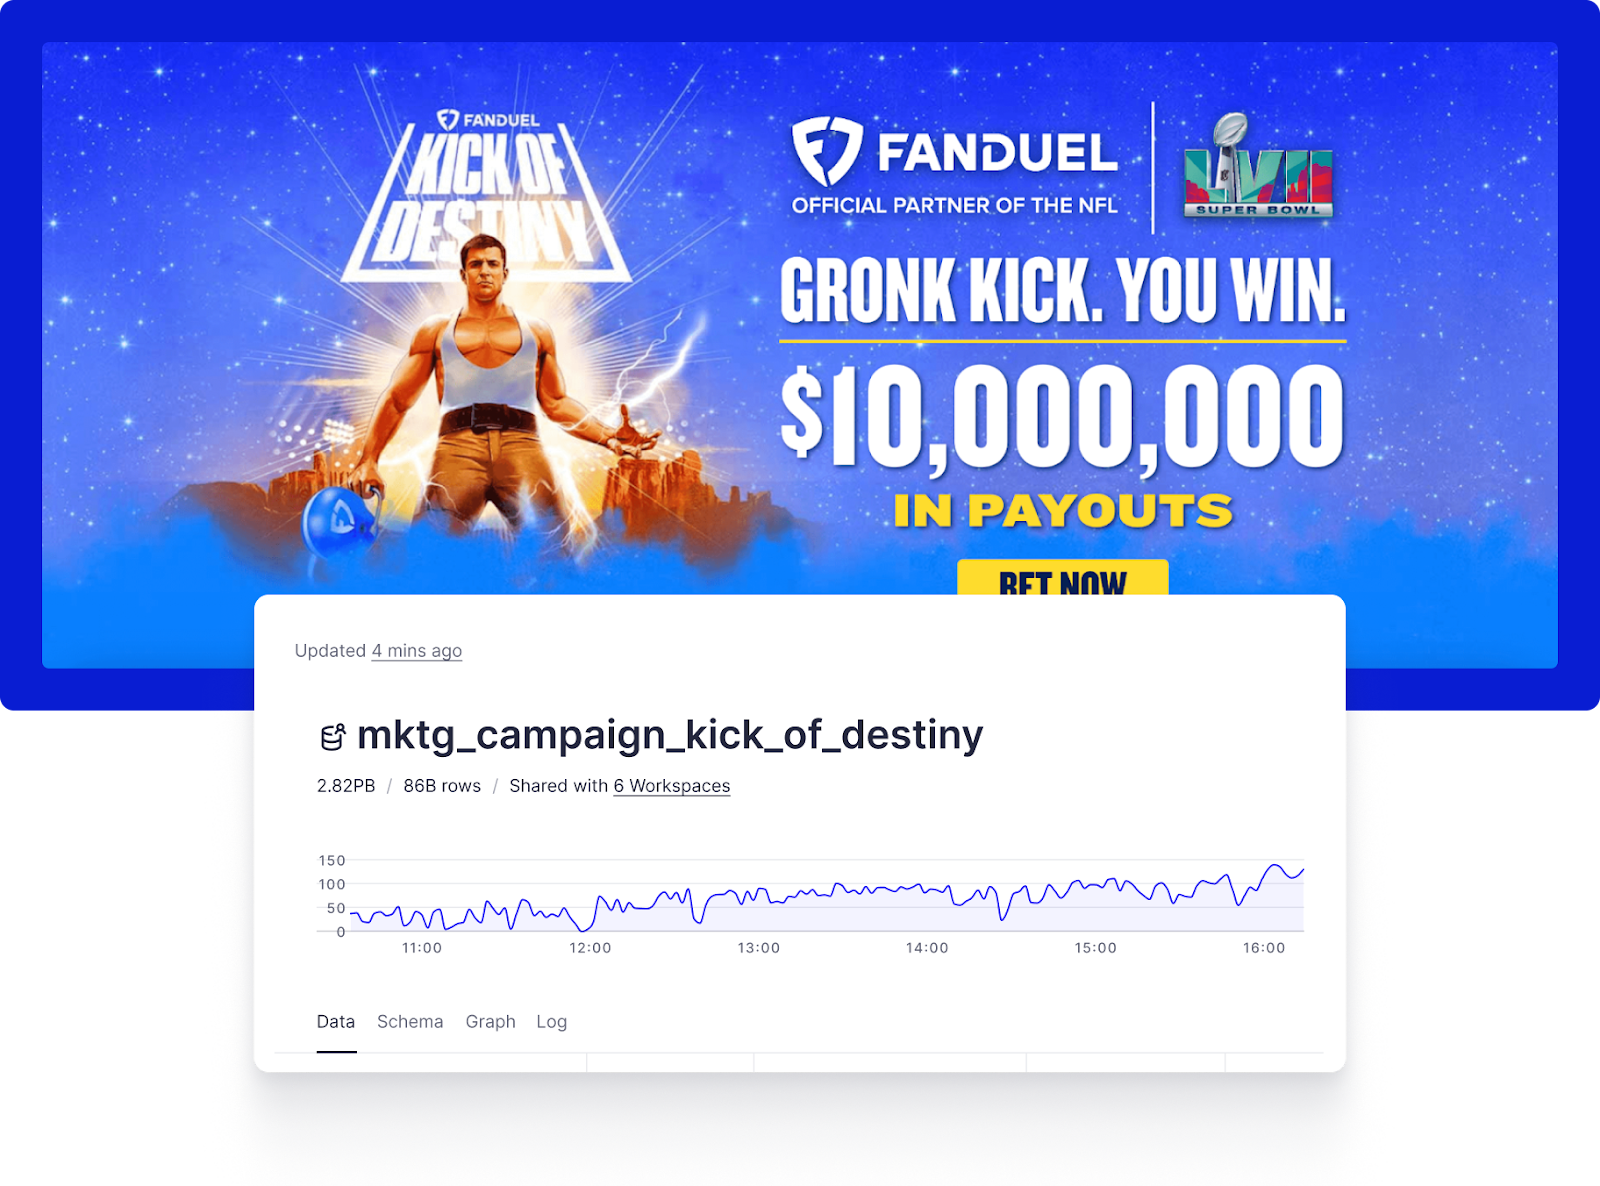
Real-time analytics can be used to optimize marketing campaigns in real-time. For example, FanDuel is North America's largest online sports betting platform.
FanDuel uses real-time analytics to build and monitor optimized marketing campaigns in real-time. In addition, FanDuel is able to personalize user betting journeys, identify fraud and problem gambling in real time, and provide VIP customer service, all thanks to real-time analytics.
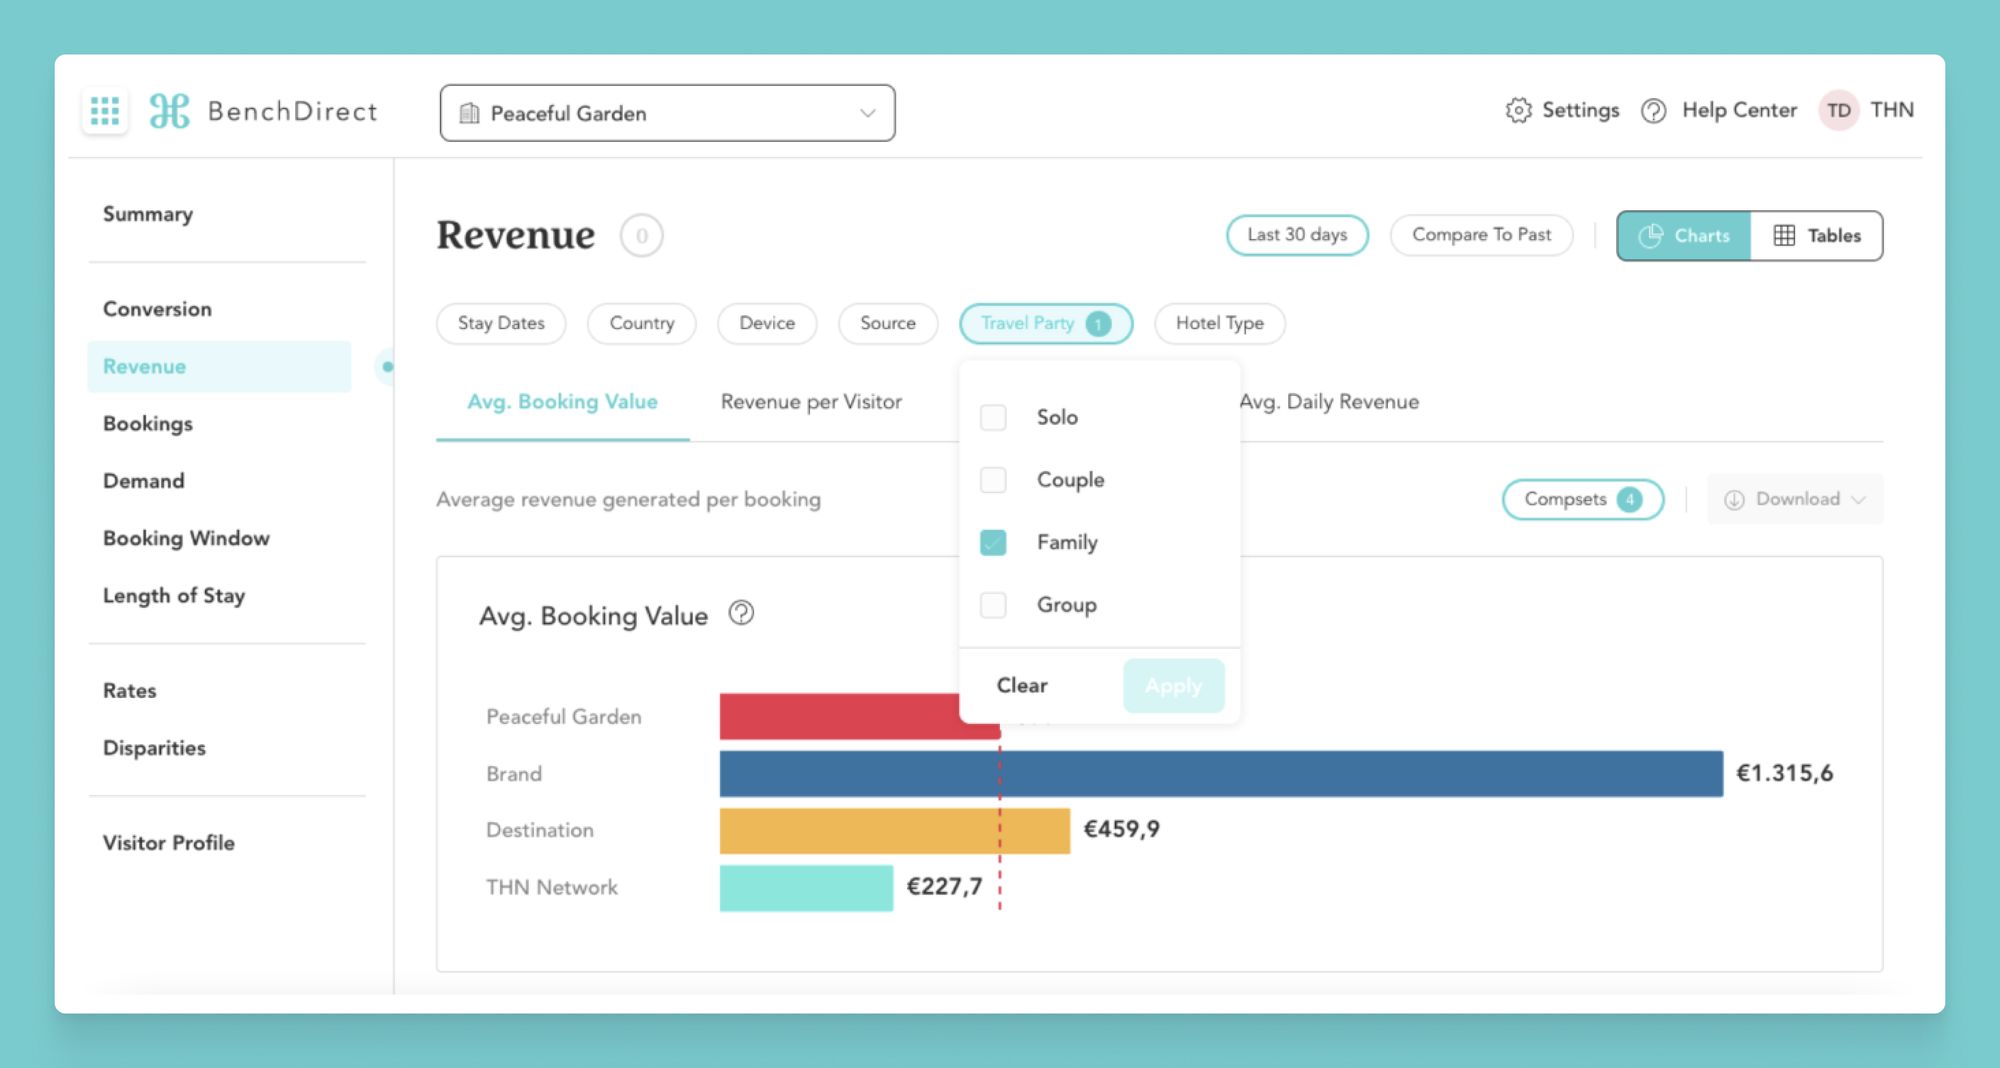
Real-time analytics can be applied to real-time personalization use cases. For example, The Hotels Network is an online booking platform that hoteliers use to place personalized booking offers in front of their customers based on real-time data.
The Hotels Network utilizes a real-time analytics platform to capture user browsing behavior as clickstream events as soon as they are generated, process hundreds of millions of real-time data points every day, and expose personalized data recommendations on their customers' websites as the user is browsing. In addition, customers of The Hotels Network can use real-time data to benchmark their booking performance against their competitors.
By dynamically updating a user's booking experience and offering real-time insights into competitive behavior using real-time analytics, The Hotels Network dramatically improves conversion rates for its customers.
Real-time analytics can be used to create up-to-date content feeds based on user preferences. For example, companies like daily.dev use real-time analytics to create personalized news feeds for their users.
The real-time analytics platform captures user content interaction events in real-time and creates a real-time API that prioritizes content based on real-time user preferences. The result is a new, highly personalized news feed that updates every time it's refreshed.
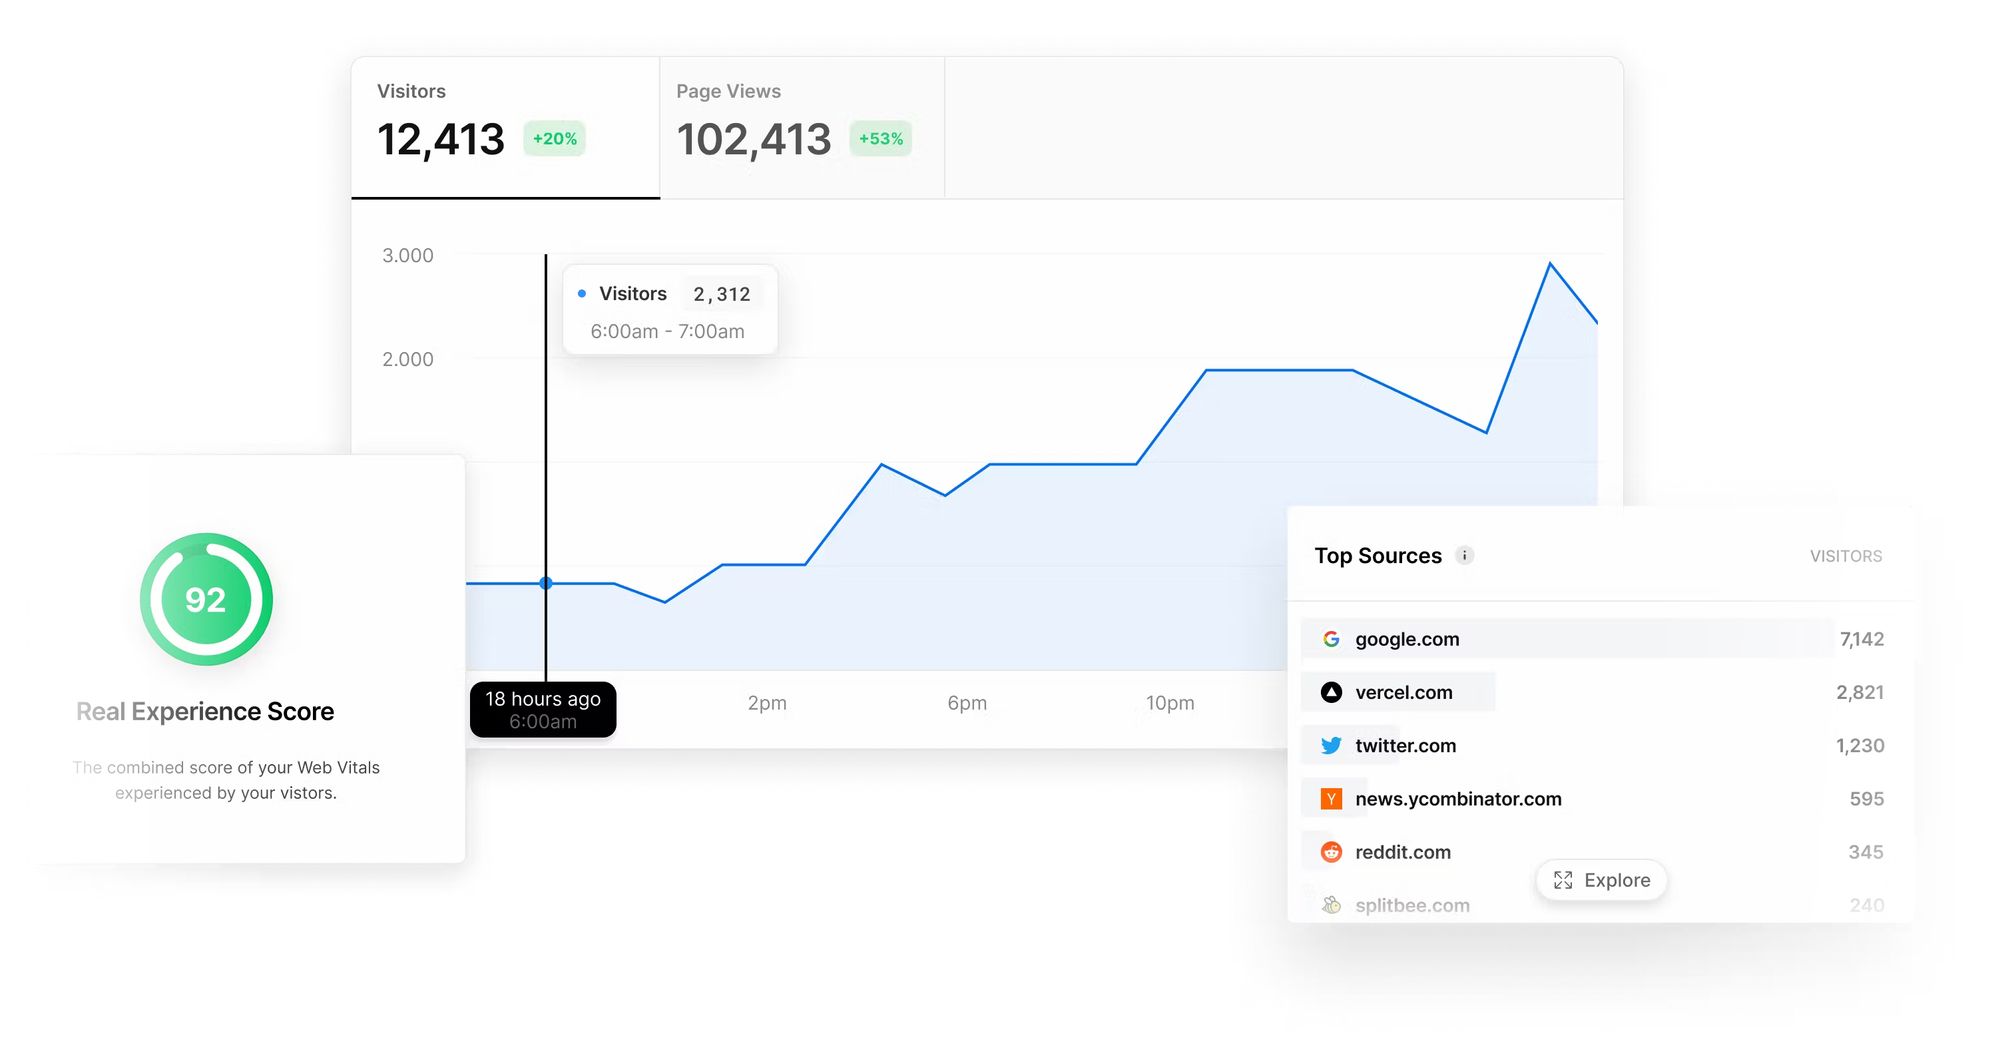
Real-time analytics can be used to build user-facing analytics dashboards that update in real-time. For example, Vercel is a platform for web developers to build, preview, and deploy web applications.
Vercel uses real-time analytics to show its users how their users are interacting with their web applications in real-time. Vercel's customers no longer have to wait 24 hours or more for data to begin populating in their analytics dashboards. Using real-time analytics, Vercel has increased customer adoption by analyzing petabytes of data every day in real time.
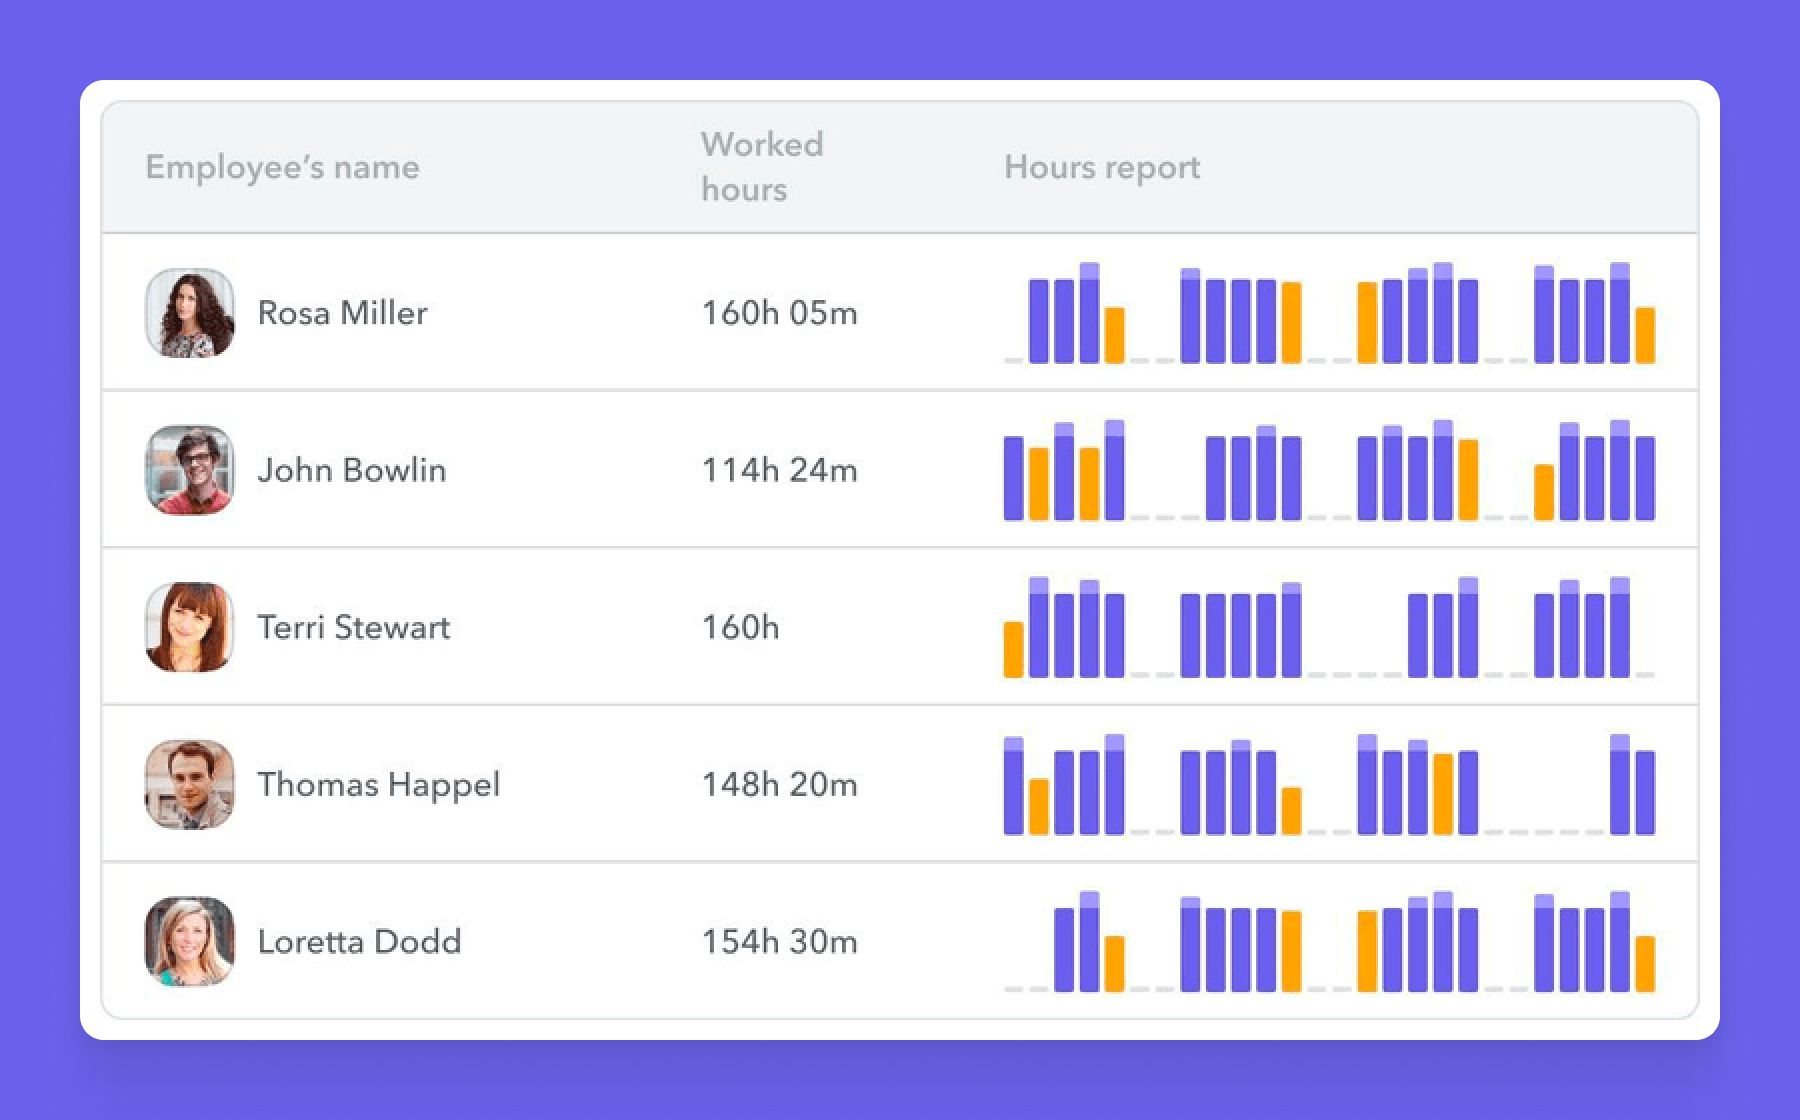
Real-time analytics can be used to show customers how they are interacting with SaaS products. For example, Factorial is a modern HR SaaS that is changing the way employees interact with their employers.
Factorial uses real-time analytics to build user-facing dashboards that show employees how to optimize the way the work, and give employers tools for better managing employee satisfaction and productivity.
All of this is powered by real-time analytics that analyzes user interactions with their online HR platform in real-time.
As the above examples indicate, real-time analytics can be used for more than just dashboarding, instead being applied in many ways to improve customer experiences, optimize user-facing features based on real-time data, and unlock new business opportunities. Below is a long list of use cases for which real-time analytics is an ideal approach:
Some benefits of adopting real-time analytics include:
Real-time analytics is becoming increasingly popular thanks to the many opportunities it unlocks for businesses that want to leverage real-time data. Here's how real-time analytics is increasing the value of companies' data.
Real-time data analytics answers complex questions within milliseconds, a feat that batch processing cannot achieve. In doing so, it allows for time-sensitive reactions and interventions (for example, in healthcare, manufacturing, or retail settings) made by humans who can interpret data more quickly to spur faster decisions.
Real-time data doesn’t just boost human decision making, but increasingly enables automated decisions within software. Software applications and services can interact with the outputs of real-time analytics systems to automate functions based on real-time metrics.
Real-time data can provide insights into customer behavior, preferences, and sentiment as they use products and services. Applications can then provide interactive tools that respond to customer usage, share information with customers through transparent in-product visualizations, or personalize their product experience within an active session.
Everybody thinks real-time analytics is more costly than batch analytics. In fact, real-time data can be used to optimize business processes, reducing costs and improving efficiency. This could include identifying and acting on cost-saving opportunities, such as reducing energy consumption in manufacturing processes or optimizing fleet routes.
Real-time data analytics can also help identify performance bottlenecks or identify testing problems early, enabling developers to quickly optimize application performance both before and after moving systems to production.
Real-time data can create a competitive moat for businesses that build it well. Businesses that integrate real-time data into their products generally provide better, more differentiated customer experiences.
In addition, real-time data provides a two-pronged speed advantage: It not only enables the development of differentiating features but also provides faster feedback loops based on customer needs. Companies that use real-time data can get new features to market more quickly and outpace competitors.
Building a real-time analytics system can feel daunting. In particular, seven challenges arise when making the shift from batch to real-time:
Real-time data analytics demands a different toolset than traditional batch data pipelines, business intelligence, or basic app development. Instead of data warehouses, batch ETLs, DAGs, and OLTP or document-store app databases, engineers building real-time analytics need to use streaming technologies, real-time databases, and API layers effectively.
And because speed is so critical in real-time analytics, engineers must bridge these components with minimal latency, or turn to a real-time data platform that integrates each function.
Either way, developers and data teams must adopt new tools when building real-time applications.
Of course, using new tools won’t help if you’re stuck in a batch mindset.
Batch processing (and batch tooling like dbt or Airflow) often involves regularly running the same query to constantly recalculate certain results based on new data. In effect, much of the same data gets processed many times.
But if you need to have access to those results in real-time (or over fresh data), that way of thinking does not help you.
A real-time mindset focuses on minimizing data processing - optimizing to process raw data only once - to both improve performance and keep costs low.
To minimize query latencies and process data at scale while it’s still fresh, you have to:
Real-time data analytics combines the scale of “Big Data” with the performance and uptime requirements of user-facing applications.
Batch processes are less prone to the negative effects caused by spikes in data generation. Like a dam, they can control the flow of data. But real-time applications must be able to handle and process ingestion peaks in real-time. Consider an eCommerce store on Black Friday. To support use cases like real-time personalization during traffic surges, your real-time infrastructure must respond to and scale with massive data spikes.
To succeed with real-time analytics, engineers need to be able to manage and maintain data projects at scale and in production. This can be difficult without adding additional tooling and or hiring new resources.
Failures in real-time infrastructure happen fast. Detecting and remediating scenarios that can negatively impact production requires real-time observability that can keep up with real-time infrastructure.
If you’re building real-time data analytics in applications, it’s not enough for those applications to serve low-latency APIs. Your observability and alerting tools need to have similarly fast response times so that you can detect user-affecting problems quickly.
In a batch context, schema migrations and failed data pipelines might only affect internal consumers, and the effects appear more slowly. But in real-time applications, these changes will have immediate and often external ramifications.
For example, changing a schema in a dbt pipeline that runs every hour gives you exactly one hour to deploy and test new changes without affecting any business process.
Changes in real-time infrastructure, on the other hand, only offer milliseconds before downstream processes are affected. In real-time applications, schema evolutions and business logic changes are more akin to changes in software backend applications, where an introduced bug will have an immediate and user-facing effect.
In other words, changing a schema while you are writing and querying over 200,000 records per second is challenging, so a good migration strategy and tooling around deployments is critical.
Up until recently, data engineers and software developers often focused on different objectives. Data engineers and data platform teams built infrastructure and pipelines to serve business intelligence needs. Software developers and product teams designed and built applications for external users.
With real-time data analytics, these two functions must come together. Companies pursuing real-time analytics must lean on data engineers and platform teams to build real-time infrastructure or APIs that developers can easily discover and build with. Developers must understand how to use these APIs to build real-time data applications.
As you and your data grow, managing this collaboration becomes critical. You need systems and workflows in place that let developers and engineers “flow” in their work while still enabling effective cross-team work.
This shift in workflows may feel unfamiliar and slow. Still, data engineers and software developers will have to work closely to succeed with real-time data analytics.
Many are concerned that the cost of real-time data analytics will outweigh the benefits. Because of the challenges that real-time analytics poses, controlling costs with real-time analytics can be difficult. This is especially true for teams making the transition from batch data processing to real-time processing.
Real-time analytics demands new tools, new ways of working, increased collaboration, added scale, and complex deployment models. These factors introduce new dependencies and requirements that, depending on your design, can create serious cost sinks.
If you’re not careful, added costs can appear anywhere and in many ways: more infrastructure and maintenance, more SREs, slower time to market, and added tooling.
There is always a cost associated with change, but real-time analytics doesn't have to be more expensive than traditional approaches. In fact, if you do it right, you can achieve an impressive ROI with real-time analytics.
Here are a few tips for controlling costs when building real-time analytics:
In theory, the consequences of unoptimized queries are mitigated when the query is only being run infrequently.
Real-time data architectures consist of three core components:
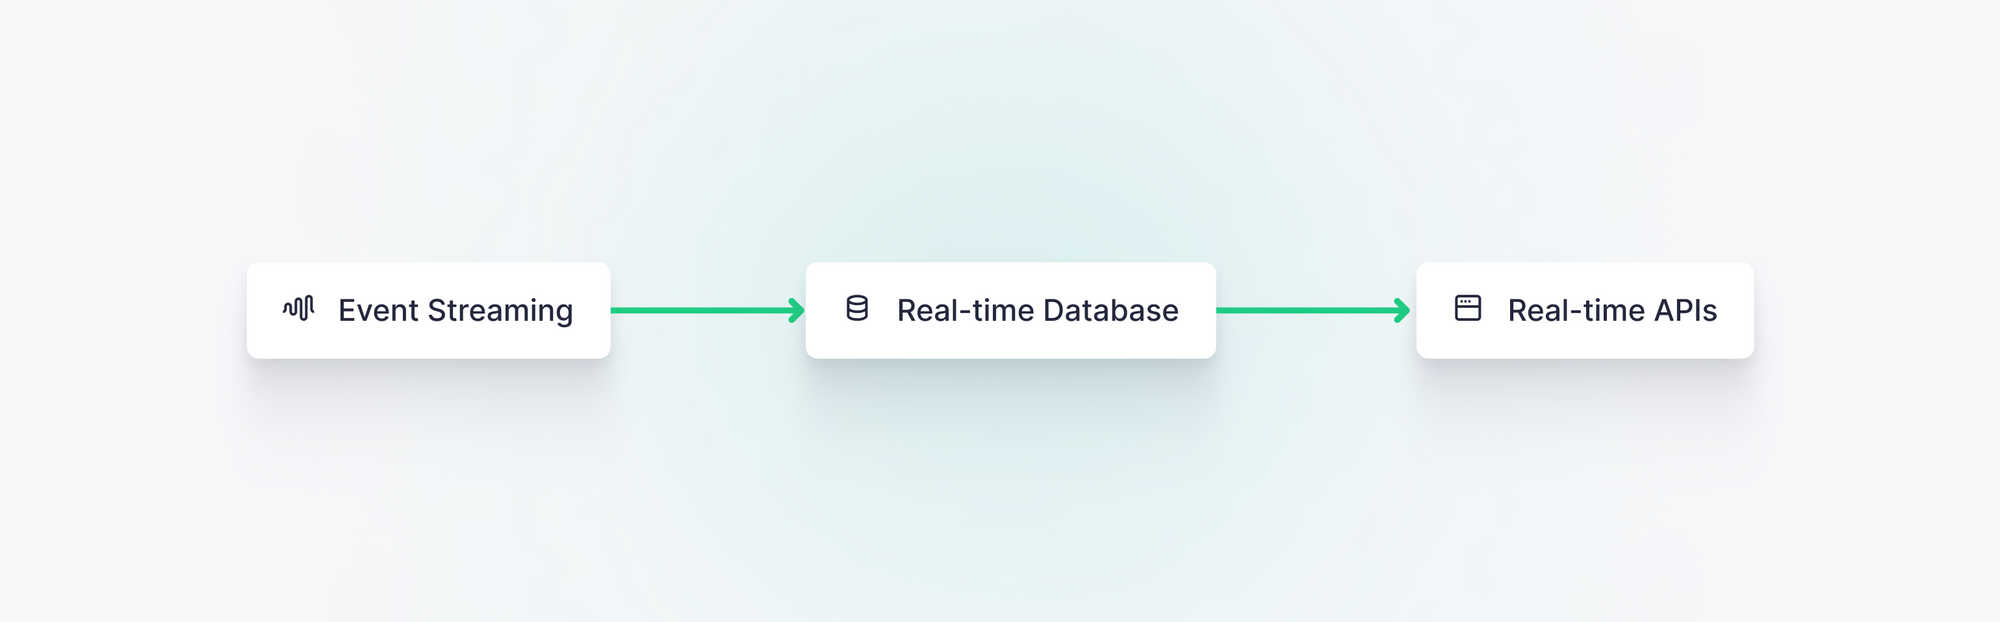
Combined, these core components can be integrated and augmented to build many different variations of scalable real-time data architectures.
Below you'll find lists of common tools and technologies that can be used to build real-time analytics:
Since real-time data analytics requires high-frequency ingestion of events data, you’ll need a reliable way to capture streams of data generated by applications and other systems.
The most commonly used data streaming technology is Apache Kafka, an open-source distributed event streaming platform used by many. Within the Kafka ecosystem exist many “flavors” of Kafka offered as a service or with alternative client-side libraries. Notable options here include:
While Kafka and its offshoots are broadly favored in this space, a few alternatives have been widely adopted, for example:
Regardless of which streaming platform you choose, the ability to capture streaming data is fundamental to the real-time data analytics stack.
Real-time analytics architectures tend to include a columnar real-time database that can store incoming and historical events data and make it available for low-latency querying.
Real-time databases should offer high throughput on inserts, columnar storage for compression and low-latency reads, and functional integrations with publication layers.
Critically, most standard transactional and document-store databases are not suitable for real-time analytics, so a column-oriented OLAP should be the database of choice.
The following databases have emerged as the most popular open-source databases for real-time analytics:
Real-time databases are built for high-frequency inserts, complex analytics over large amounts of data, and low-latency querying.
To make use of data that has been stored in real-time databases, developers need a publication layer to expose queries made on that database to external applications, services, or real-time data visualizations. This often takes the form of an ORM or an API framework.
One particular challenge with building real-time data architectures is that analytical application databases tend to have less robust ecosystems than their OLTP counterparts, so there are often fewer options to choose from here, and those that exist tend to be less mature and with smaller communities.
So, publication layers for real-time data analytics generally require that you build your own custom backend to meet the needs of your application. This means building yet another HTTP API using tools like:
Each of the 3 core components - data streaming technology, real-time database, and API layer - matters when building the ideal real-time data architecture, and while such an architecture can be constructed piecemeal, beware of technical handoffs that inevitably introduce latency and complexity.
Recently, real-time data platforms such as Tinybird have combined these core components into a unified and integrated technology stack, providing in a managed service the critical functionality for building and maintaining real-time analytics.
The next wave of real-time applications and systems require extraordinary processing speed and storage and have been historically difficult and expensive to build.
But that changes with Tinybird.
Tinybird is the industry-leading real-time analytics platform. With Tinybird, developers and data teams can harness the power of real-time data to quickly and cost-effectively build real-time data analytics and the applications they power.
Here's how Tinybird handles the performance requirements of real-time analytics:
Beyond table-stakes performance metrics, Tinybird makes it simple to rapidly develop, ship, and maintain real-time data analytics at scale.
Use Tinybird to ingest data from multiple sources at millions of events per second, query and shape that data using the 100% pure SQL you already know and love, and publish your queries as low-latency, high-concurrency REST APIs to consume in your applications.
Tinybird is a force multiplier for data teams and developers building real-time data analytics. Here are the factors that influence Tinybird’s position as the top real-time analytics platform in 2023.
"Tinybird is a force multiplier. It unlocks so many possibilities without having to hire anyone or do much additional work. It’s faster than anything we could do on our own. And, it just works."
Senior Data Engineer, Top 10 Sports Betting and Gaming Company
The operative phrase of 2023 is “do more with less.” You’re under pressure to reduce costs but maintain the same, if not greater, level of service. Fortunately, a real-time data platform like Tinybird can help you capture new value at a fraction of the cost.
Here are a few ways that Tinybird enables cost-effective development:
"Tinybird provides exactly the set of tools we need to very quickly deliver new user-facing data products over the data investments we’ve already made. When we switched to Tinybird, we ran a PoC and shipped our first feature to production in a month. Since then, we’ve shipped 12 new user-facing features in just a few months. There’s no way we could have done this without Tinybird."
Marc Gonzalez, Director of Data, Factorial HR
So how do you begin to build real-time data analytics into your next development project? As this guide has demonstrated, there are 3 core steps to building real-time data analytics:
Below you’ll find practical steps on ingesting data from streaming platforms (and other sources), querying that data with SQL, and publishing low-latency, high-concurrency APIs for consumption within your applications.
If you’re new to Tinybird, you can try it out by signing up for a free-forever Build Plan, with no credit card required, no time restrictions, and generous free limits.
Tinybird supports ingestion from multiple sources, including streaming platforms, files, databases, and data warehouses. Here’s how to code ingestion from various sources using Tinybird.
Tinybird enables real-time data ingestion from Kafka using the native Kafka connector. You can use the Tinybird UI to set up your Kafka connection, choose your topics, and define your ingestion schema in a few clicks. Or, you can use the Tinybird CLI to develop Kafka ingestion pipelines from your terminal.
To learn more about building real-time data analytics on top of Kafka data, check out these resources:
Note that this applies to any Kafka-compatible platform such as Confluent, Redpanda, Upstash, Aiven, or Amazon MSK.
Tinybird works as a real-time publication layer for data stored in data warehouses. With Tinybird, you can synchronize tables in your data warehouses - such as BigQuery, Redshift, or Snowflake - develop metrics in SQL, and publish those metrics as low-latency, high-concurrency APIs.
Tinybird’s Connector Development Kit has made it possible to quickly ingest data from many data warehouses into Tinybird.
Check out these resources below to learn how to build real-time data analytics on top of your data warehouse:
Tinybird makes it easy to build real-time analytics over files stored in Amazon S3. With Tinybird, you can synchronized data from CSV, NDJSON, or Parquet files stored in Amazon S3, develop analytics with SQL, and publish your metrics as low-latency, scalable APIs.
Connecting to S3 is simple with Tinybird's S3 Connector. Just set your connection, select your bucket, define your sync rules, and start bringing S3 data directly into Tinybird.
Check out these resources below to learn how to build real-time analytics on top of object storage:
Tinybird enables data ingestion from CSV, NDJSON, and Parquet files, either locally on your machine or remotely in cloud storage such as GCP or S3 buckets. While data stored in files is often not generated in real time, it can be beneficial as dimensional data to join with data ingested through streaming platforms. Tinybird has wide coverage of SQL joins to make this possible.
You can ingest real-time data from files using the Tinybird UI, using the CLI, or using the Data Sources API.
Here are some resources to learn how to ingest data from local or remote files:
Perhaps the simplest way to capture real-time data into Tinybird is using the Events API, a simple HTTP endpoint that enables high-frequency ingestion of JSON records into Tinybird.
Because it’s just an HTTP endpoint, you can invoke the API from any application code. The Events API can handle ingestion at up to 1000 requests and 20+ MB per second, making it super scalable for most streaming use cases.
Check out the code snippets below for example usage in your favorite language.
For more info on building real-time data analytics on top of application data using the Events API, check out these resources:
For more info on building real-time data analytics on top of application data using the Events API, check out these resources:
Tinybird offers a delightful interface for building real-time analytics metrics using the SQL you know and love.
With Tinybird Pipes you can chop up more complex queries into chained, composable nodes of SQL. This simplifies development flow and makes it easy to identify queries that impede performance or increase latency.
Tinybird Pipes also include a robust templating language to extend your query logic beyond SQL and publish dynamic, parameterized endpoints from your queries.
Below are some example code snippets of SQL queries written in Tinybird Pipes for simple real-time analytics use cases.
For more info on building real-time data analytics metrics with Tinybird Pipes, check out these resources:
Tinybird shines in its publication layer. Whereas other real-time data platforms or technologies may still demand that you build a custom backend to support user-facing applications, Tinybird massively simplifies application development with instant REST API publication from SQL queries.
Every API published from a Tinybird Pipe includes automatically generated, OpenAPI-compatible documentation, security through auth token management, and built-in observability dashboards and APIs to monitor endpoint performance and usage.
Furthermore, Tinybird APIs can be parameterized using a simple templating language. By utilizing the templating language in your SQL queries, you can build robust logic for dynamic API endpoints.
To learn more about how to build real-time data analytics APIs with Tinybird, check out these resources:
Ready to experience the industry-leading real-time data platform? Request a demo from Tinybird. Our engineers will assess your use case and prepare a tailored, customized demo that shows you how to use Tinybird to get your real-time analytics use cases to market, faster.